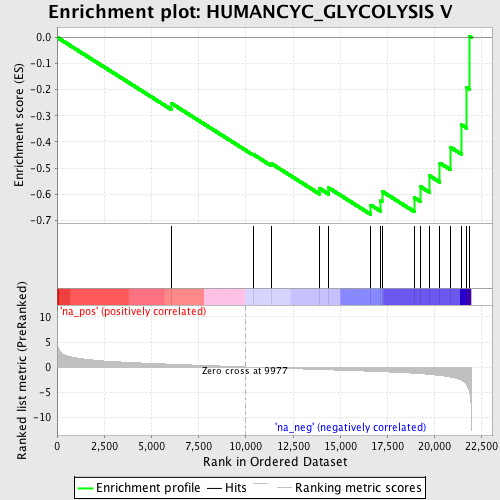
Profile of the Running ES Score & Positions of GeneSet Members on the Rank Ordered List
| Dataset | set02_ATM_minus_versus_BT_ATM_minus |
| Phenotype | NoPhenotypeAvailable |
| Upregulated in class | na_neg |
| GeneSet | HUMANCYC_GLYCOLYSIS V |
| Enrichment Score (ES) | -0.67710507 |
| Normalized Enrichment Score (NES) | -1.8307912 |
| Nominal p-value | 0.0017152659 |
| FDR q-value | 0.060781624 |
| FWER p-Value | 0.644 |
| PROBE | GENE SYMBOL | GENE_TITLE | RANK IN GENE LIST | RANK METRIC SCORE | RUNNING ES | CORE ENRICHMENT | |
|---|---|---|---|---|---|---|---|
| 1 | ALDOC | 6044 | 0.552 | -0.2517 | No | ||
| 2 | GAPDHS | 10384 | -0.062 | -0.4469 | No | ||
| 3 | PGAM2 | 11345 | -0.199 | -0.4821 | No | ||
| 4 | ALDOB | 13918 | -0.501 | -0.5777 | No | ||
| 5 | PKLR | 14395 | -0.556 | -0.5755 | No | ||
| 6 | PFKM | 16625 | -0.839 | -0.6409 | Yes | ||
| 7 | BPGM | 17152 | -0.915 | -0.6254 | Yes | ||
| 8 | PFKL | 17219 | -0.925 | -0.5885 | Yes | ||
| 9 | PGK2 | 18923 | -1.246 | -0.6124 | Yes | ||
| 10 | TPI1 | 19234 | -1.320 | -0.5696 | Yes | ||
| 11 | ALDOA | 19736 | -1.473 | -0.5288 | Yes | ||
| 12 | PKM2 | 20286 | -1.691 | -0.4809 | Yes | ||
| 13 | ENO2 | 20847 | -1.997 | -0.4202 | Yes | ||
| 14 | ENO1 | 21416 | -2.605 | -0.3337 | Yes | ||
| 15 | ENO3 | 21711 | -3.589 | -0.1923 | Yes | ||
| 16 | PFKP | 21846 | -4.704 | 0.0046 | Yes |
